Stakeholder Ecommerce Report: Google Merchandise Store
This simulation presents a stakeholder report for the Google Merchandise Store with insights from Looker Studio analytics, including strategic recommendations for performance and UX optimization.
Summary
This project simulates a weekly stakeholder report based on the Google Merchandise Store analytics dashboard. The focus was on surfacing key performance metrics, identifying drop-offs, and recommending improvements to product strategy and user experience.
Performance Snapshot
- Time Period: March 25 – April 21, 2025
- Sessions: 68,379
- Revenue: $178,540.83
- Purchase Conversion Rate: ~0.01%
- Average Order Value: $186.95
Key Observations
- Major drop-off between cart and checkout — only ~9% complete purchase after adding to cart
- Top products: Campus Bike, Android Plushit, Bamboo Lid Bottle
- Email and referral traffic have highest conversion rates
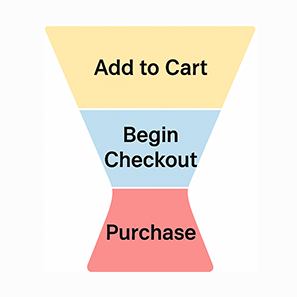
Funnel Data
| Funnel Step | Count |
|---|---|
| Sessions | ~68,000 |
| Add to Cart Events | 10,578 |
| Begin Checkout | 3,240 |
| Purchases | 962 |
Traffic Sources
| Source | Users | Conversion Rate |
|---|---|---|
| Direct | ~223,311 | 0% |
| Organic Search | ~132,035 | 0% |
| Email (Feb Campaign) | 4,256 | 0.01% |
| t.co Referral | 923 | 0.05% (highest) |
Recommendations
- Streamline payment and shipping forms
- Test bundle offers for top revenue products
- Refine acquisition strategy by aligning traffic sources with buyer intent